Data handling and high-quality illustrations for publications
course
training
git
reproducibility
quarto
gs-vmas
A course on how to handle data and create appropriate illustrations for your project.
A course on how to assess and visualize data using R, including creating suitable graphs and multi-panel figures for publications and presentations. We cover the use of GIS software to map data points with geographical and cultural elements. Additionally, the course includes merging and updating datasets in R and planning for code and raw data submission.
We were happy to be part of this GS-VMAS course, lead by Peter Halvarsson.
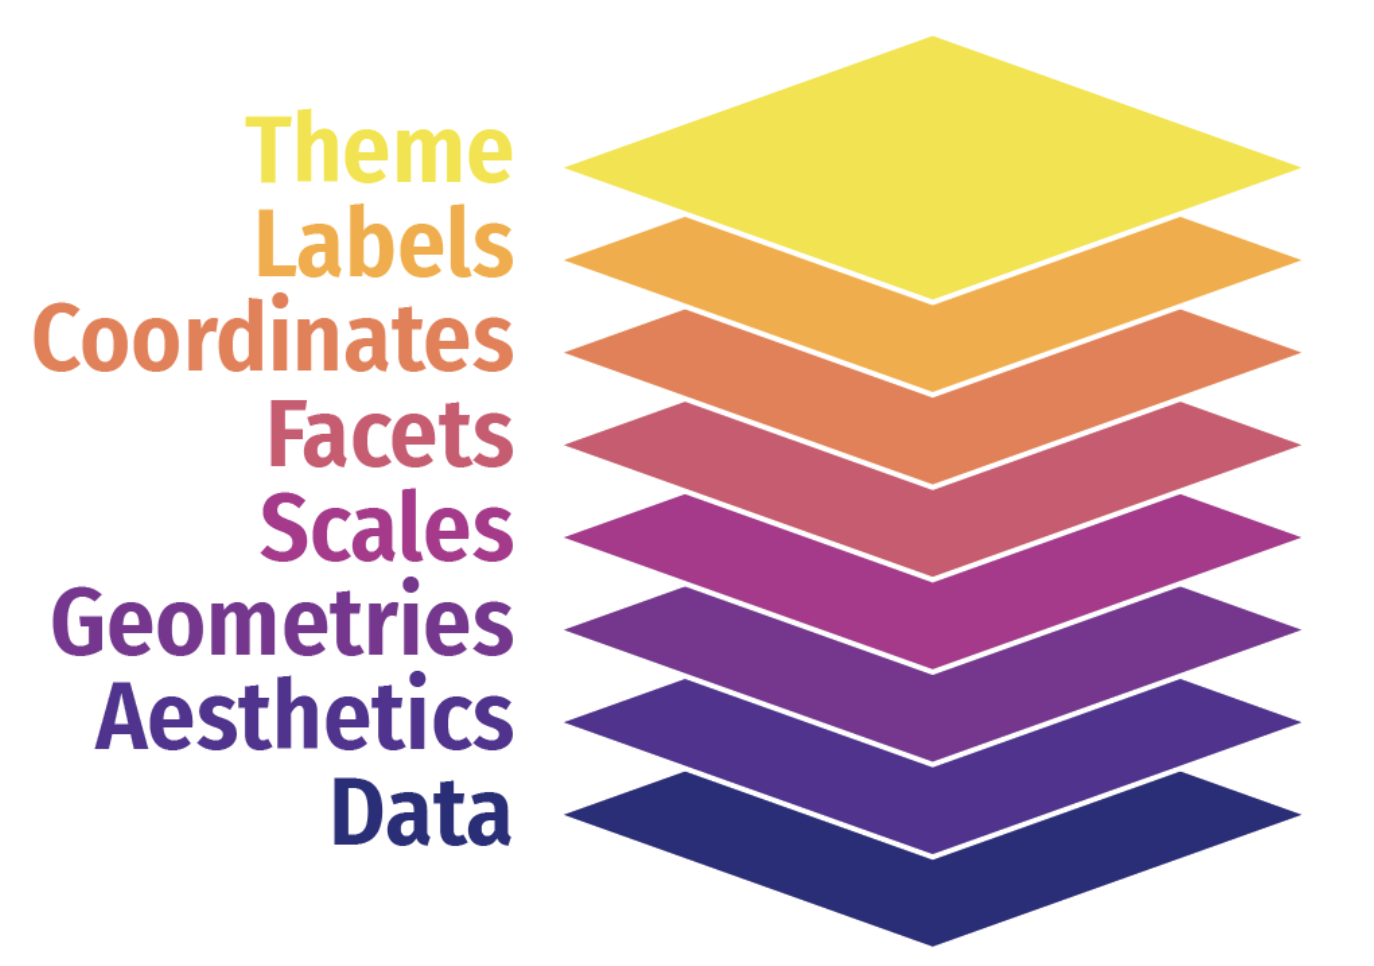
Image from: https://metricsf20.classes.ryansafner.com/slides/1.3-slides#19