Data handling and high-quality illustrations for publications
Application is now open
course
training
git
reproducibility
quarto
gs-vmas
A course on how to handle data and create appropriate illustrations for your project.
Learn how to manage, visualize, and share data effectively using R, QGIS, and open science tools. This hands-on course combines theory with practical exercises to help you:
- Organize and update datasets efficiently.
- Create clear and meaningful visualizations and maps to communicate your data.
- Explore mapping techniques using vector and raster formats with GIS software.
- Train open science by making your work reproducible and shareable online.
Students will work with real datasets, collaborate in groups, and apply new skills in a final individual project. The course includes one intensive week on campus, followed by an independent project presented online.
If you are curious, apply here.

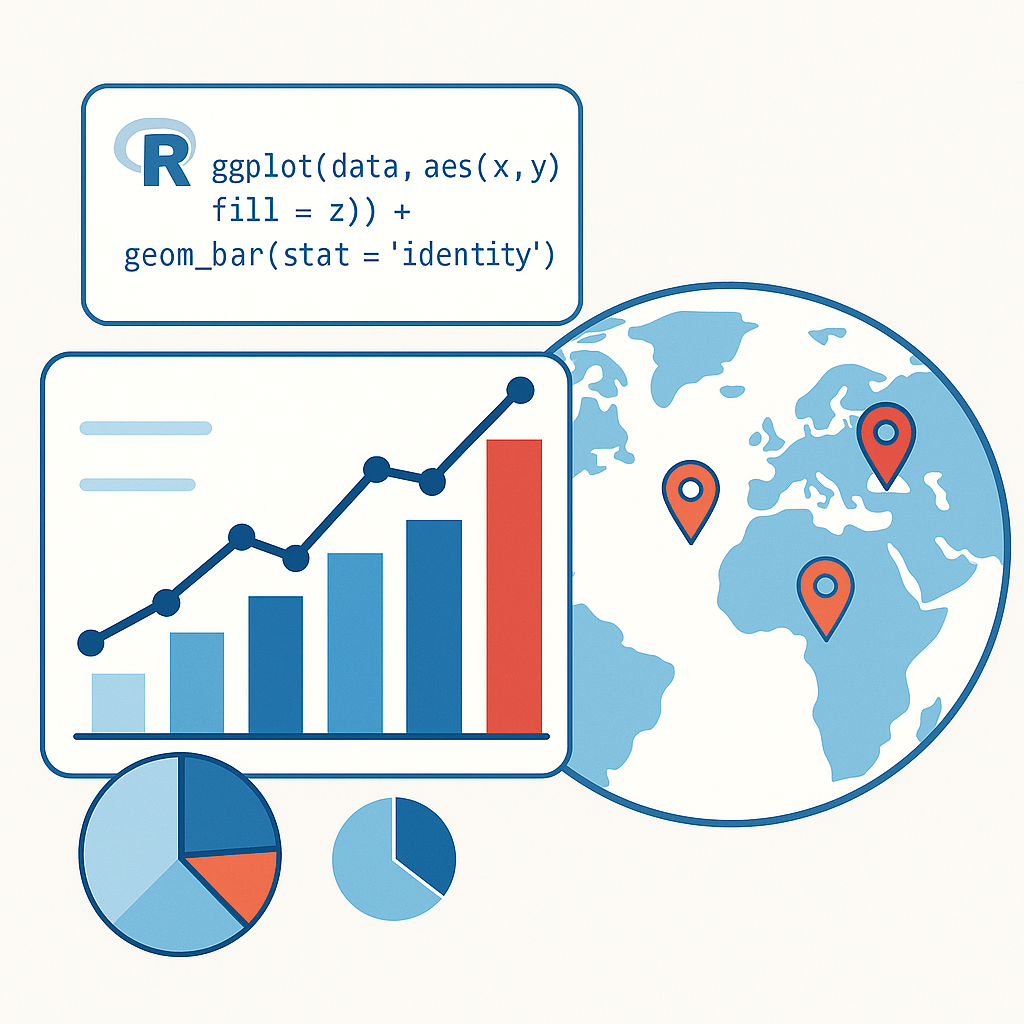
Image generated by ChatGPT